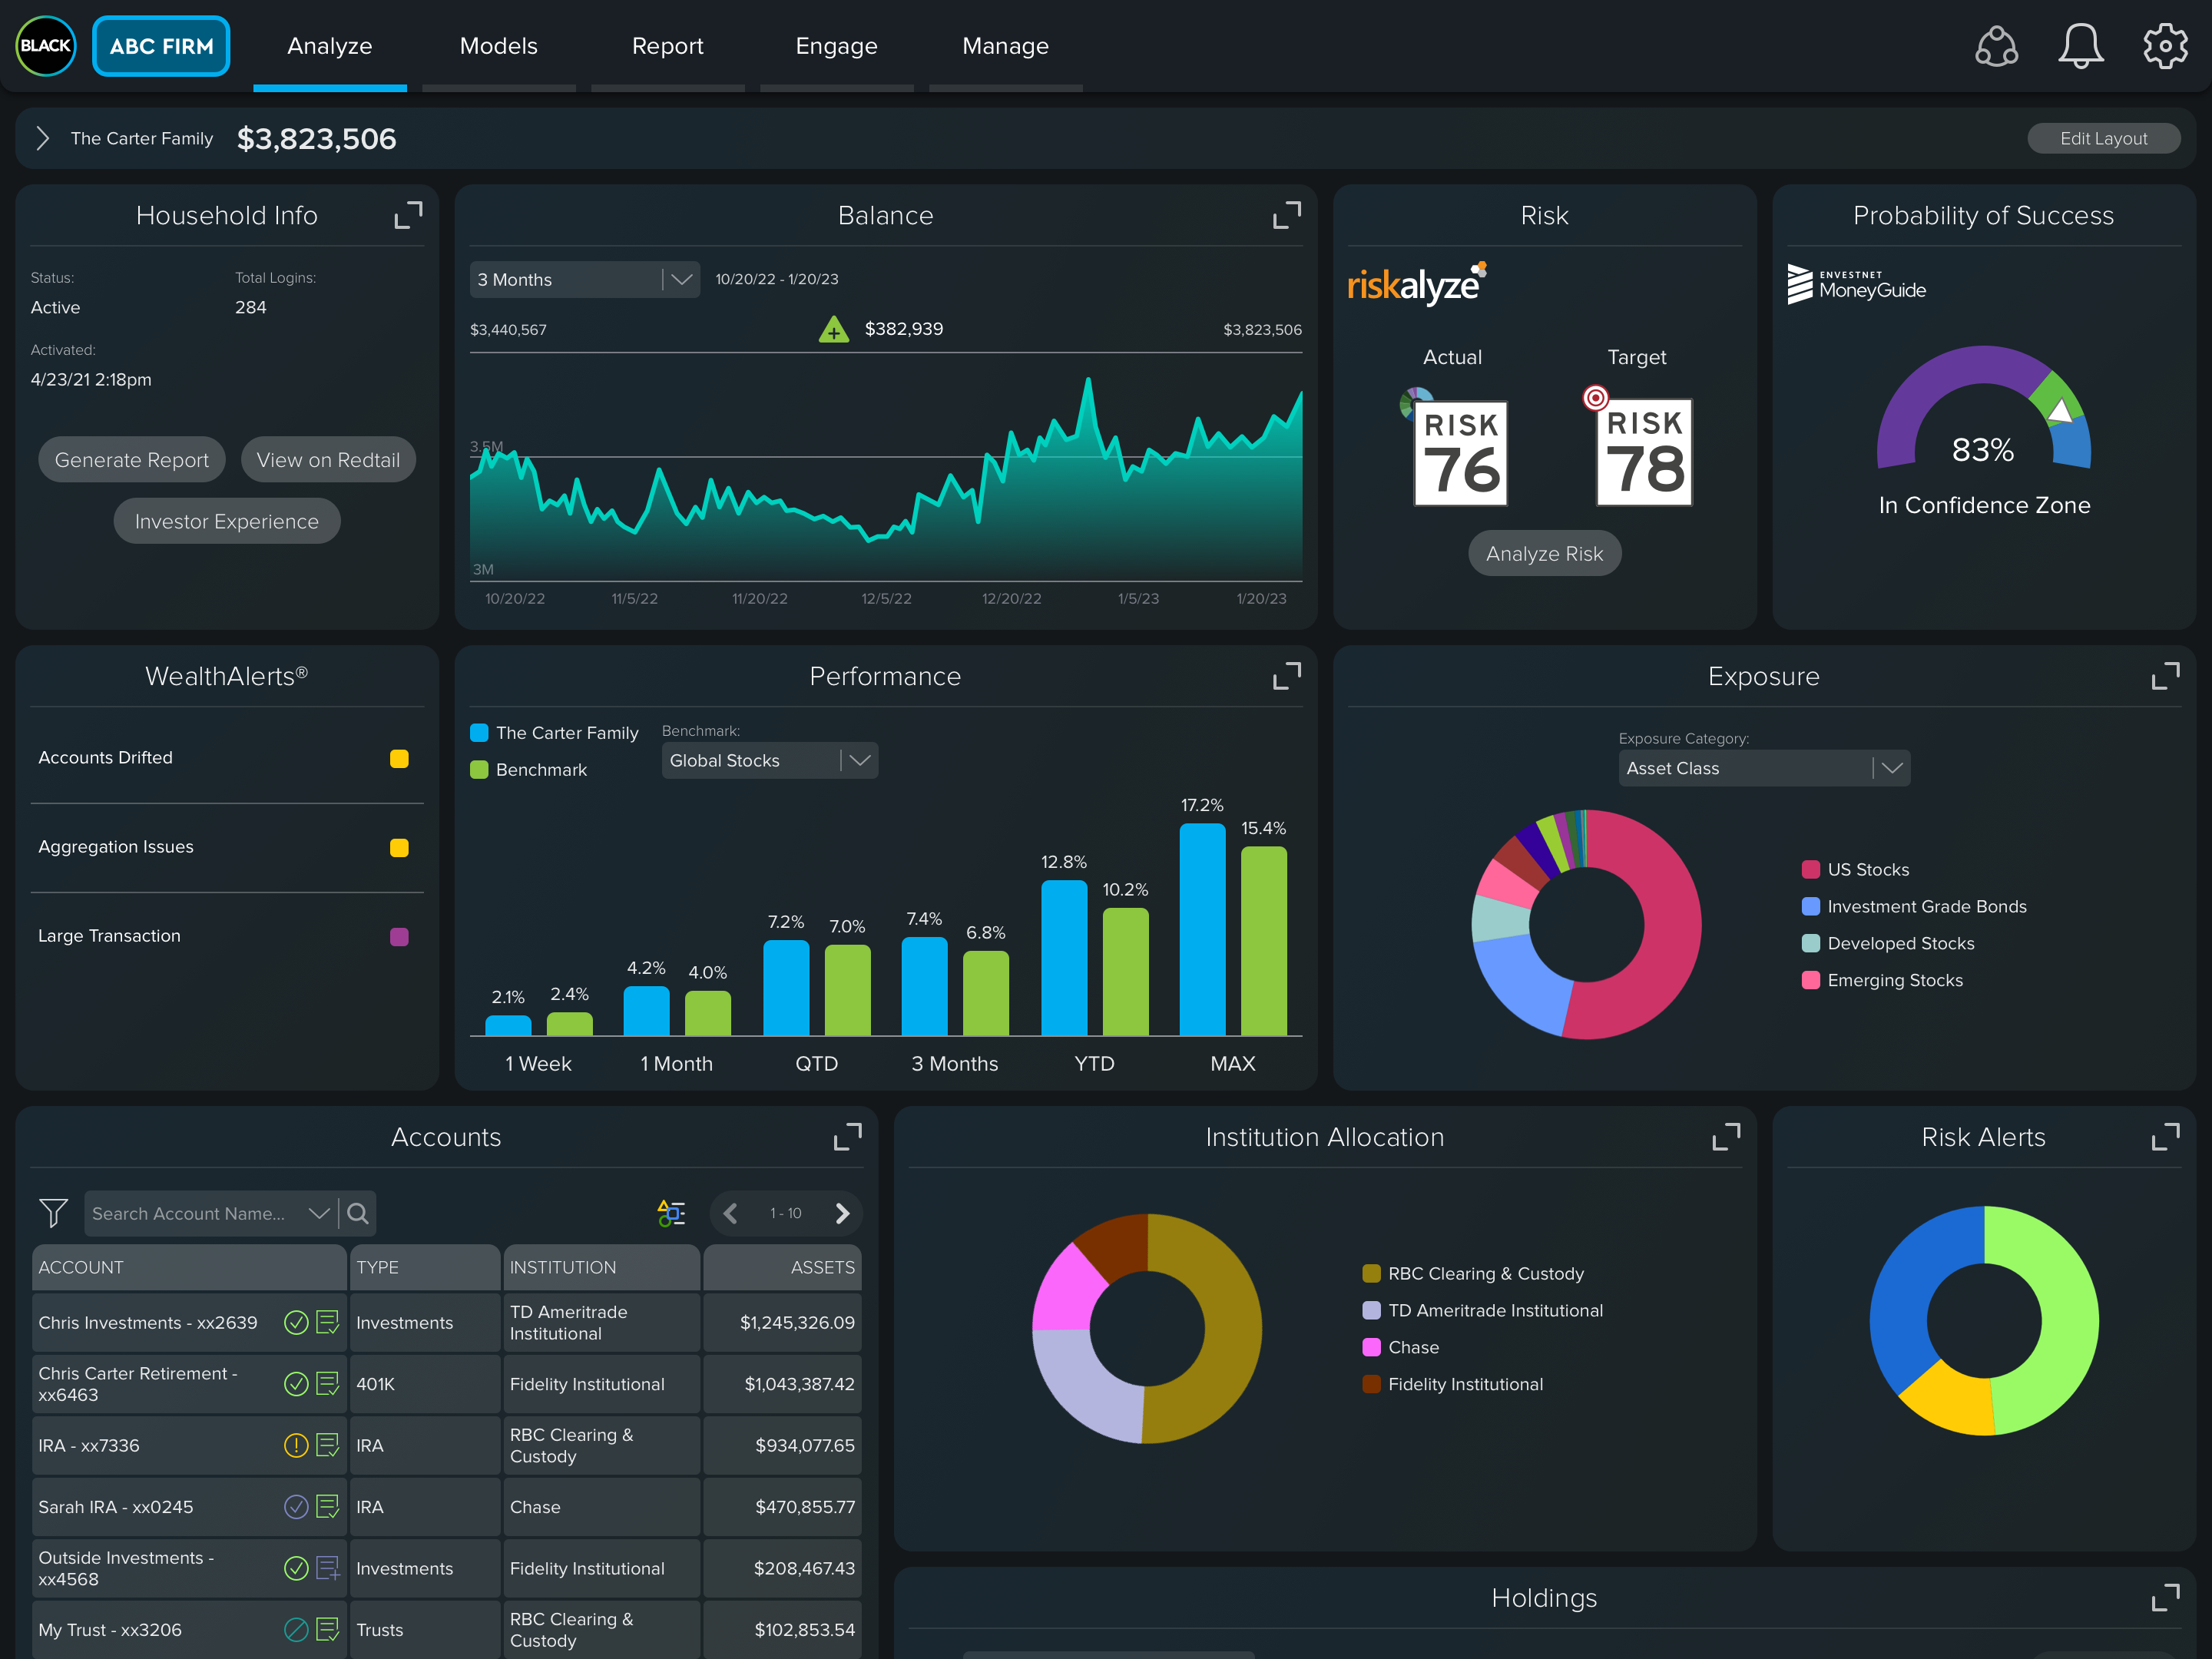
The Household Dashboard provides a comprehensive overview of all the key data points that CircleBlack brings together so you can easily perform daily heat-checks with clients.
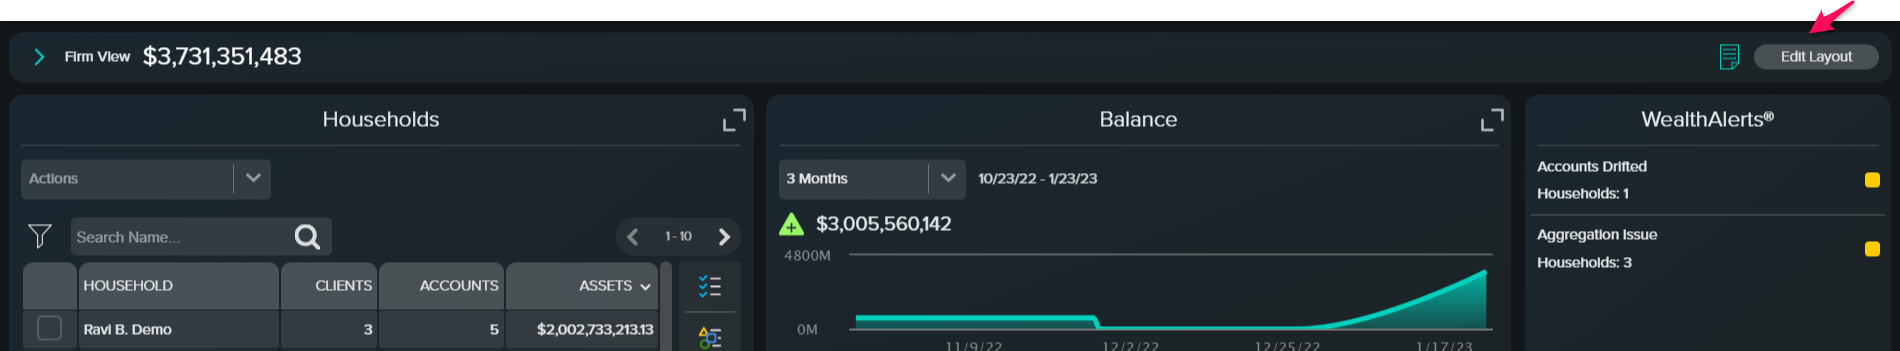
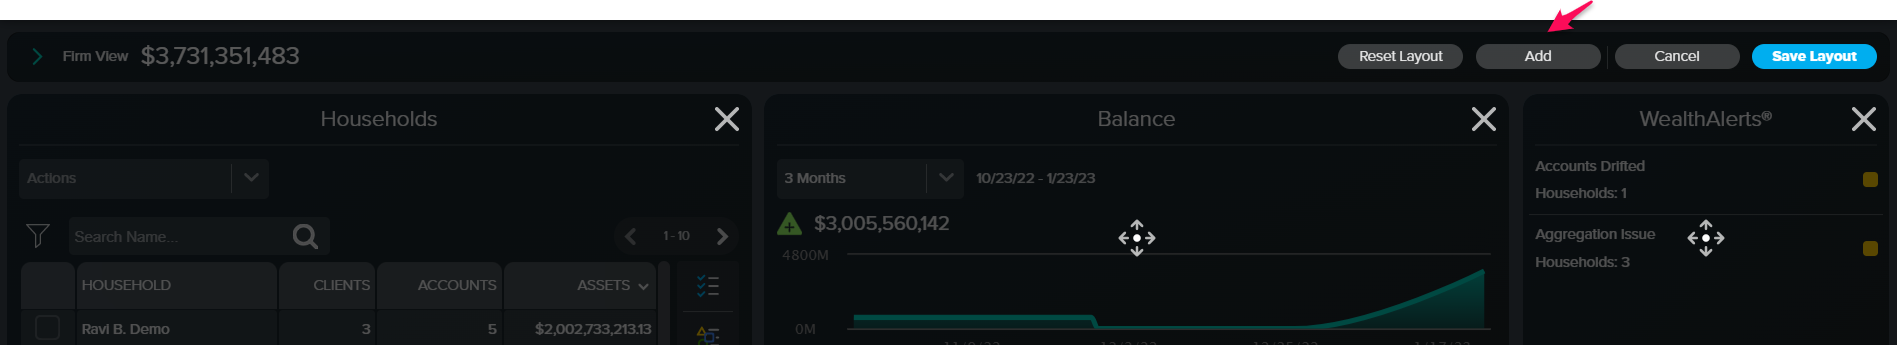
- Like the Advisor Dashboard, you can also customize which widgets display and how big or small they appear as well by clicking the Edit Layout button.
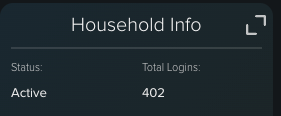
- You can also export the entire page’s data into an Excel file by clicking the Report Icon in the upper right corner of the page. Household Info shows activation status, total logins, buttons to view the clients in a connected CRM, generate report, and view the household’s Investor portal. You can expand the Household Info widget by clicking the “expand” icon to view the Household Info page:
-
From the Household Info page, you can view more household info details like the client relationships, functionality to change the household email, move clients to another household, or deactivate the household.
-
-
Click the “expand” icon in the upper right Balance shows the balance graph of the household’s portfolio over the selected time as well as the balance change. Note, this balance change reflects the total net contributions or withdrawals and investment gains or losses for the household portfolio for the given time period.
- Accounts lists all the accounts in the household’s portfolio. This includes accounts feeding in from the custodians, any manually-added accounts, and any Yodlee-linked, held-away accounts shared by the client with the Advisor. Expanding this widget provides more details on each account. You can also click on any account to view that Account’s Overview Dashboard.
- Performance shows the household’s total portfolio performance for all accounts over fixed time periods. You can also select multiple benchmarks to compare against as well.
- Note: you can change the default performance methodology (DWR or TWR), type (Gross or Net of Fees), and benchmark from your Advisor Preferences page (Gear icon → Advisor Preferences)
- Benchmarks available: Users are able to select from default benchmarks as well as any blended benchmarks created at your firm.
- Performance By Asset Class shows the household’s performance and contribution to performance by detail asset class for all accounts over fixed time periods.
- Note: you can change the default performance methodology (DWR or TWR), type (Gross or Net of Fees), and benchmark from your Advisor Preferences page (Gear icon → Advisor Preferences)
- The graph above the table displays the top 5 best performing asset classes.
-
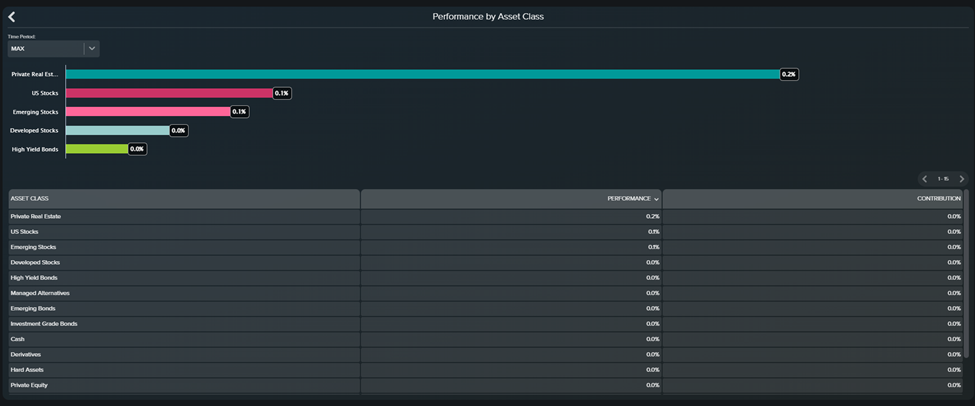
Performance By Asset Class Widget
- Exposure lists the household’s exposure using various drop down options: asset class (broad and detailed), stock and bond sectors, and geographic (region and country).
- Note: clicking in to any category row displays a new window with a “look-through” into the household’s holdings that make up that particular category’s exposure. For example, if you set the category to be “Stock Sector”, you can click on “Technology” to see all the holdings in the household with exposure to the Technology Sector.
- For more information see our Exposure methodology.
- Holdings includes all holdings across the household’s portfolio per account. The widget lists the Holding name, symbol, type, the account it’s in, the institution, the price, quantity, the holding’s performance and market value.
- Transactions provides the date, description, symbol, type, account, institution, quantity, price, and amount.
- Risk, if integrated with a Risk partner, displays the Household’s target and actual risk data points.
- Probability of Success, if integrated with MoneyGuide with a completed financial plan, shows the Household’s recommended scenario probability of success number.
- Tasks, if integrated with a CRM partner, displays the tasks imported from the CRM for the household.
- WealthAlerts shows any WealthAlerts generated for that household.
- Risk Profile, Retirement, and Drift Status Accounts Donut Graphs link to the Account list page filtered on those particular accounts.
Setting Your Default Layout
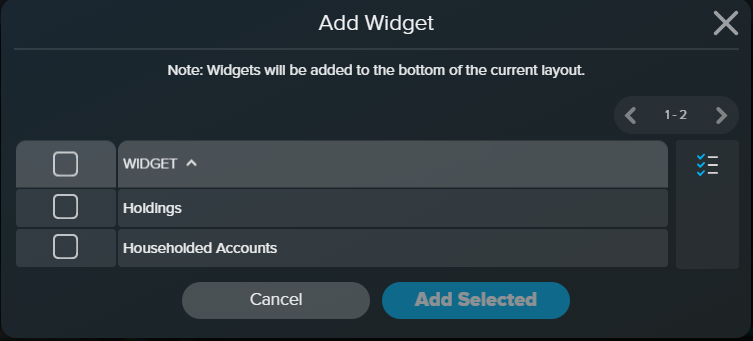
Users can update the default layout by selecting Edit Layout. Then selecting add widget to view any unselected widgets.