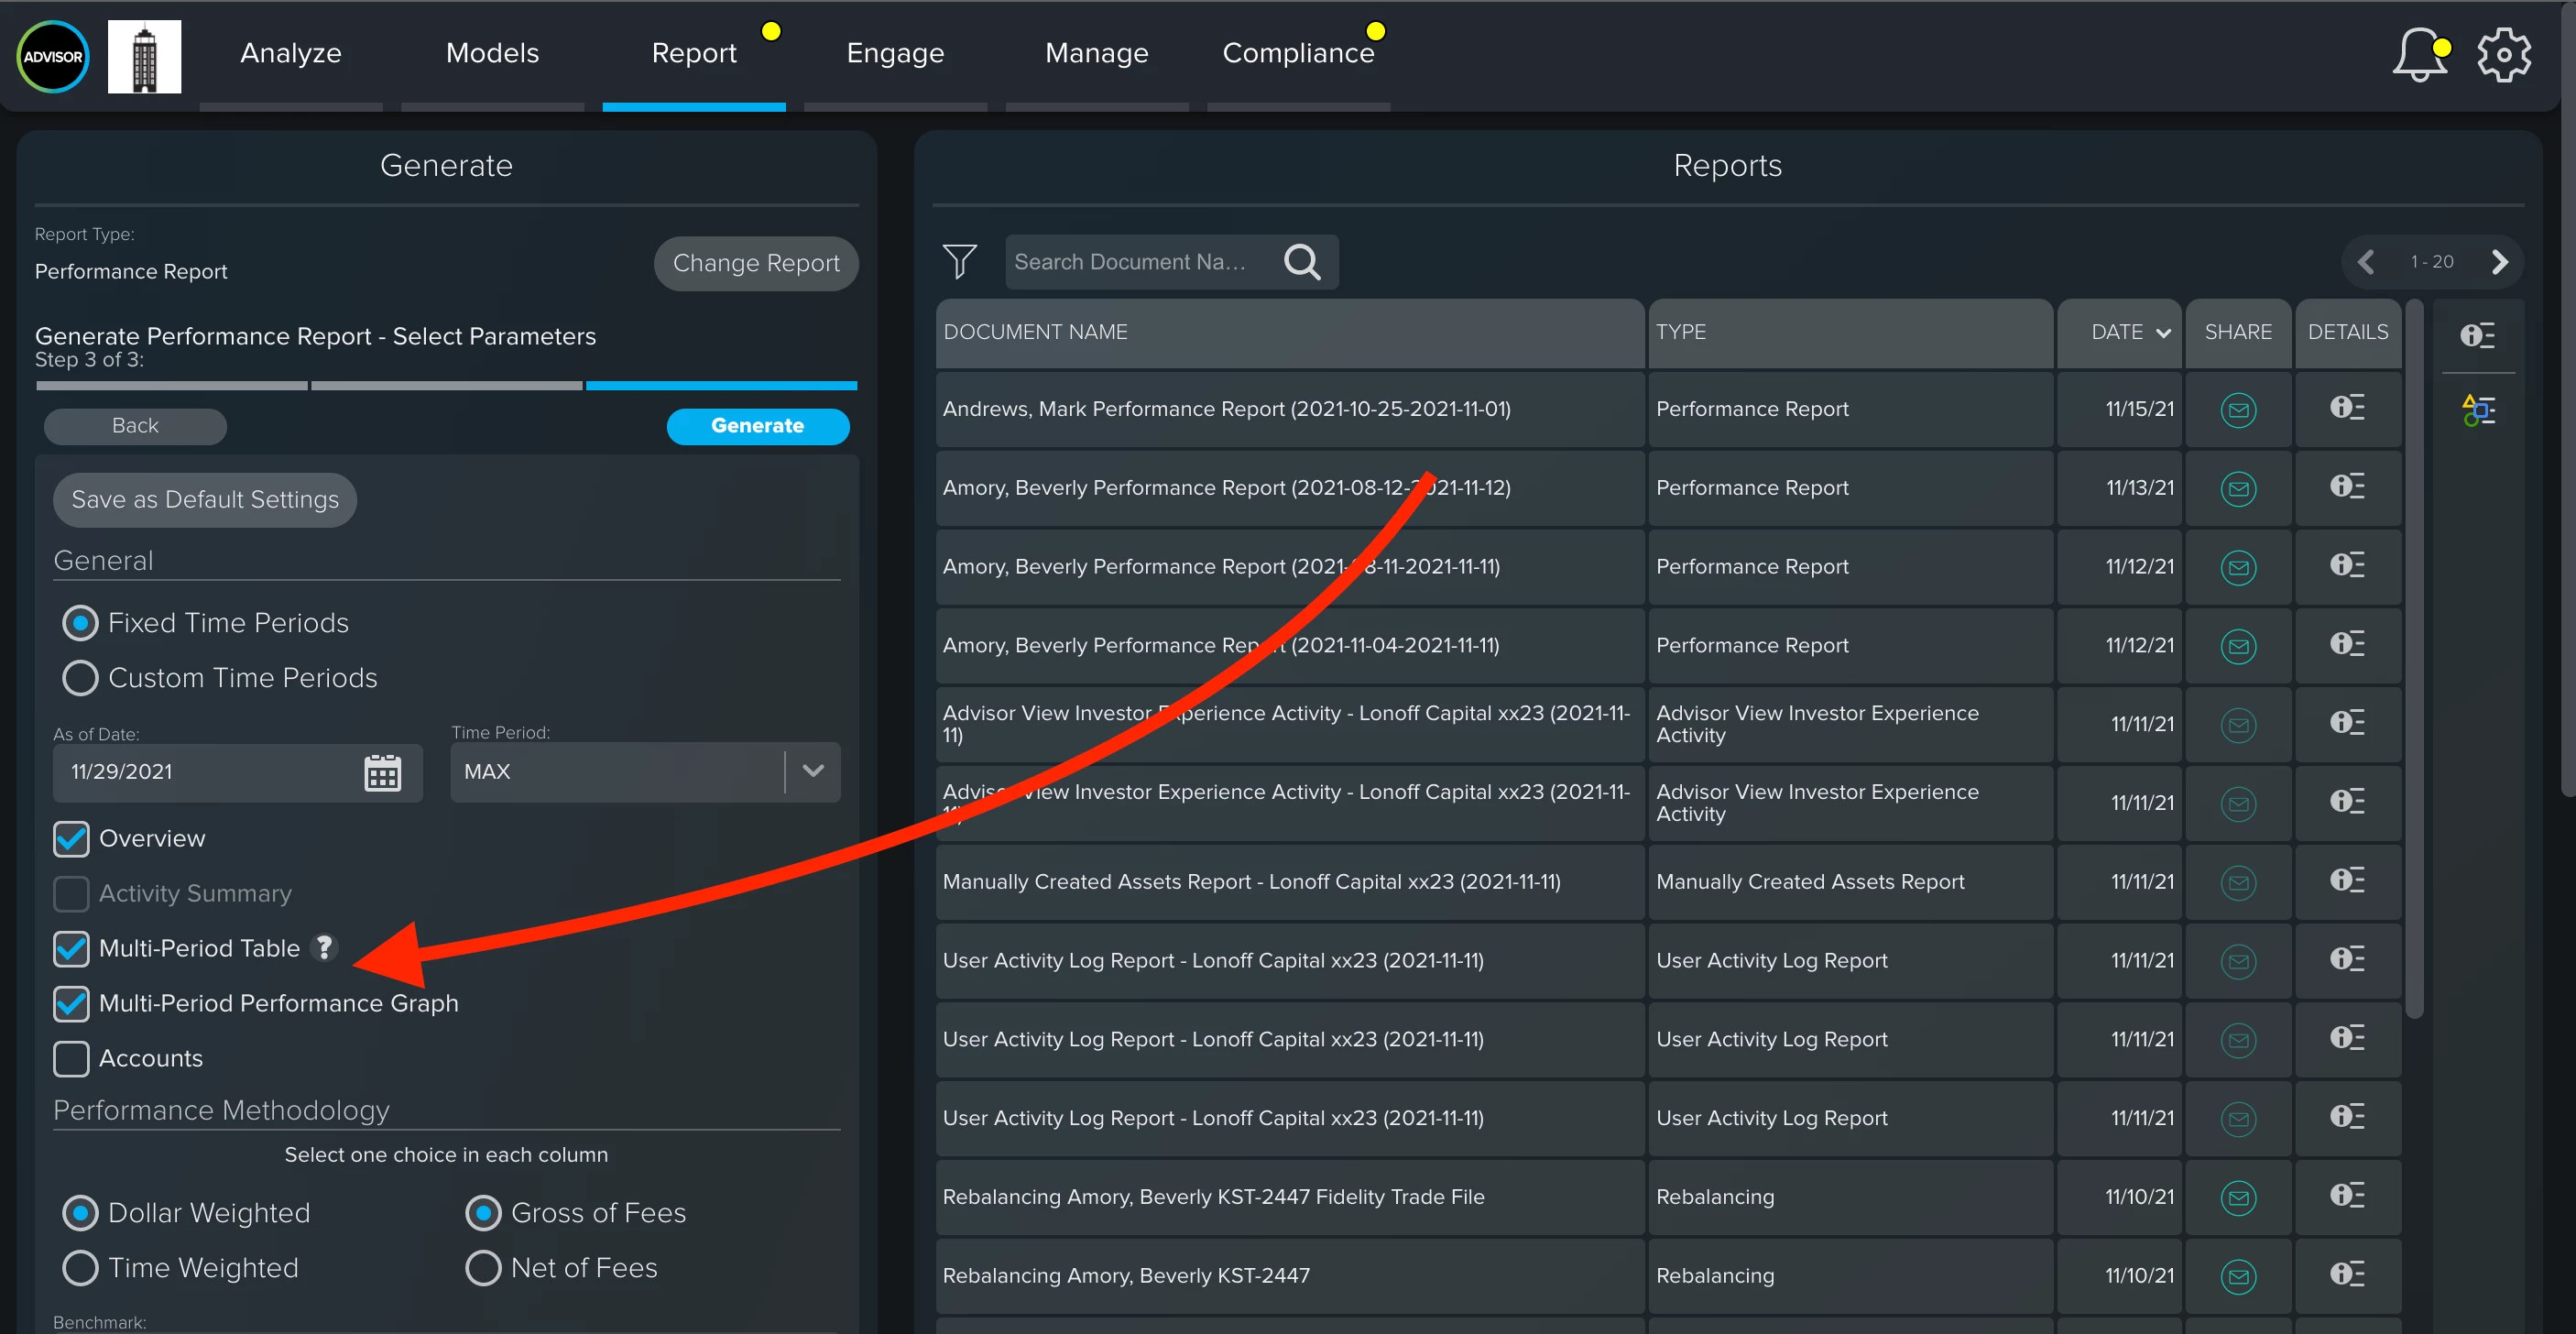
CircleBlack Performance Reporting has the option to display multi-period performance numbers in a table and bar graph on the PDF performance report. When generating a Performance Report, Advisor users can select two options:
-
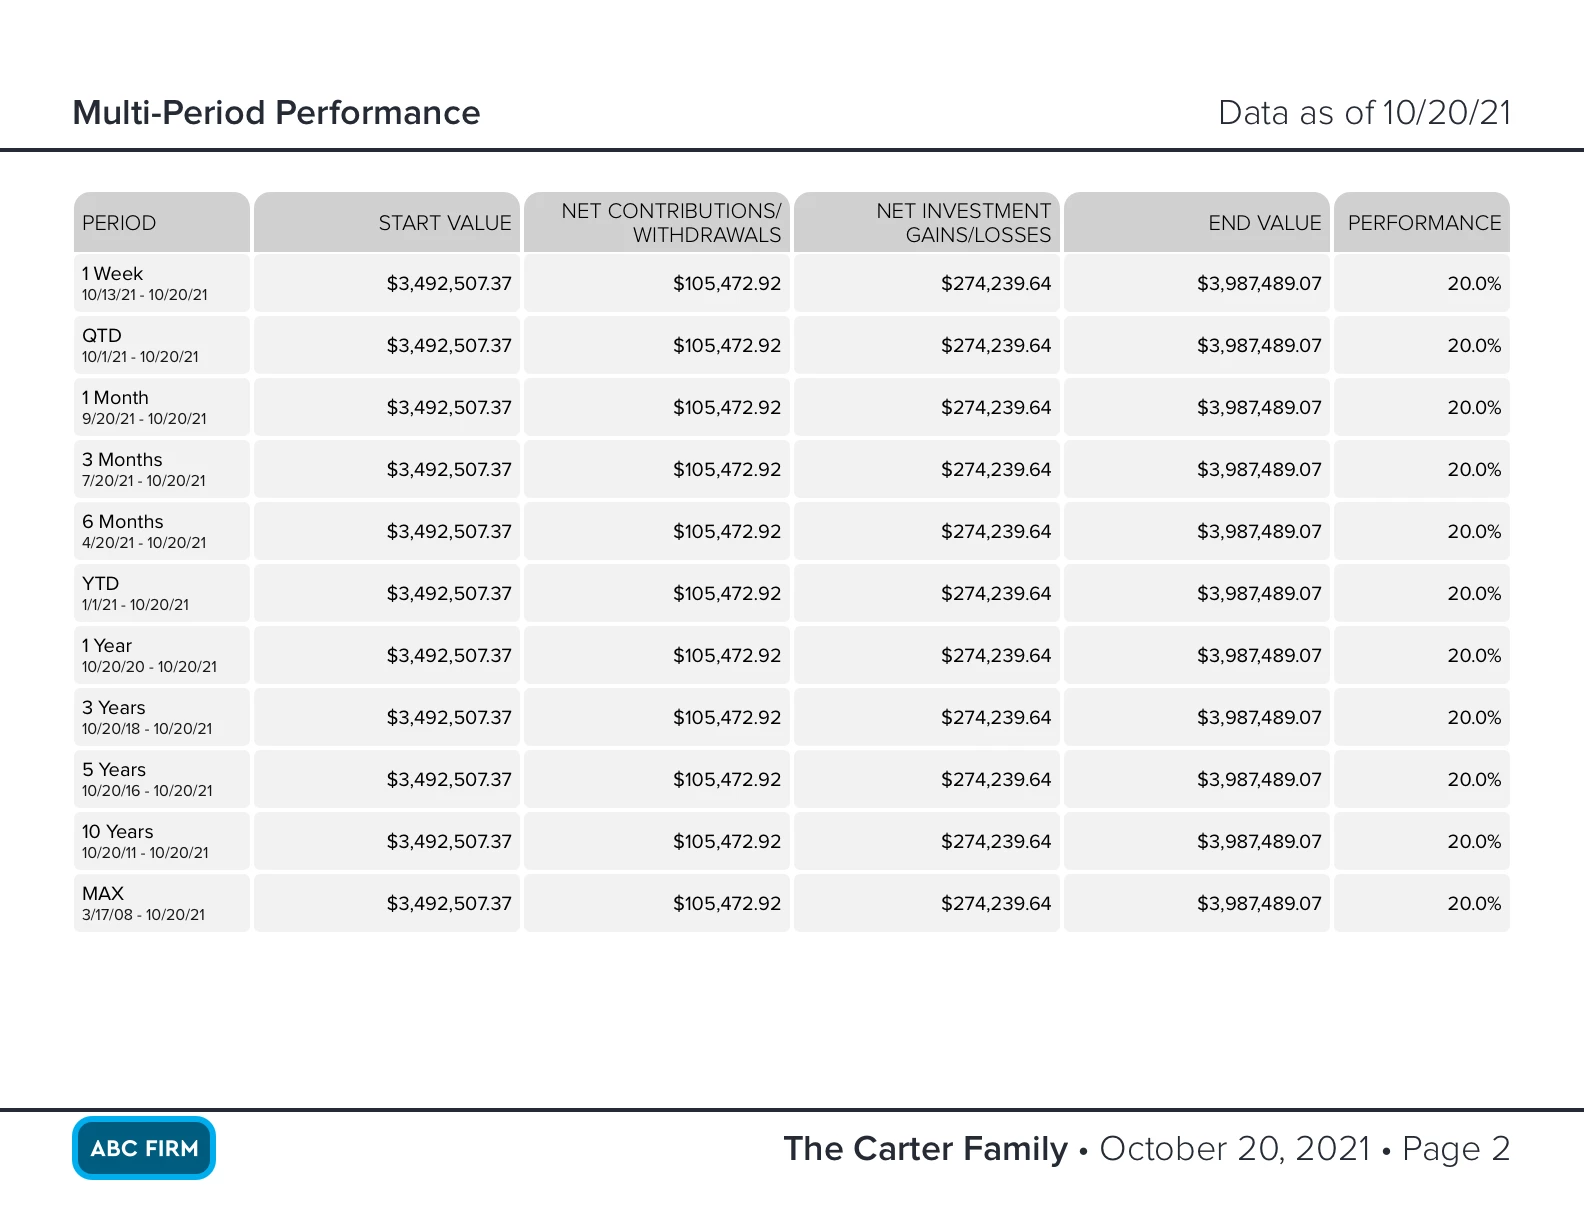
Multi-Period Table
-
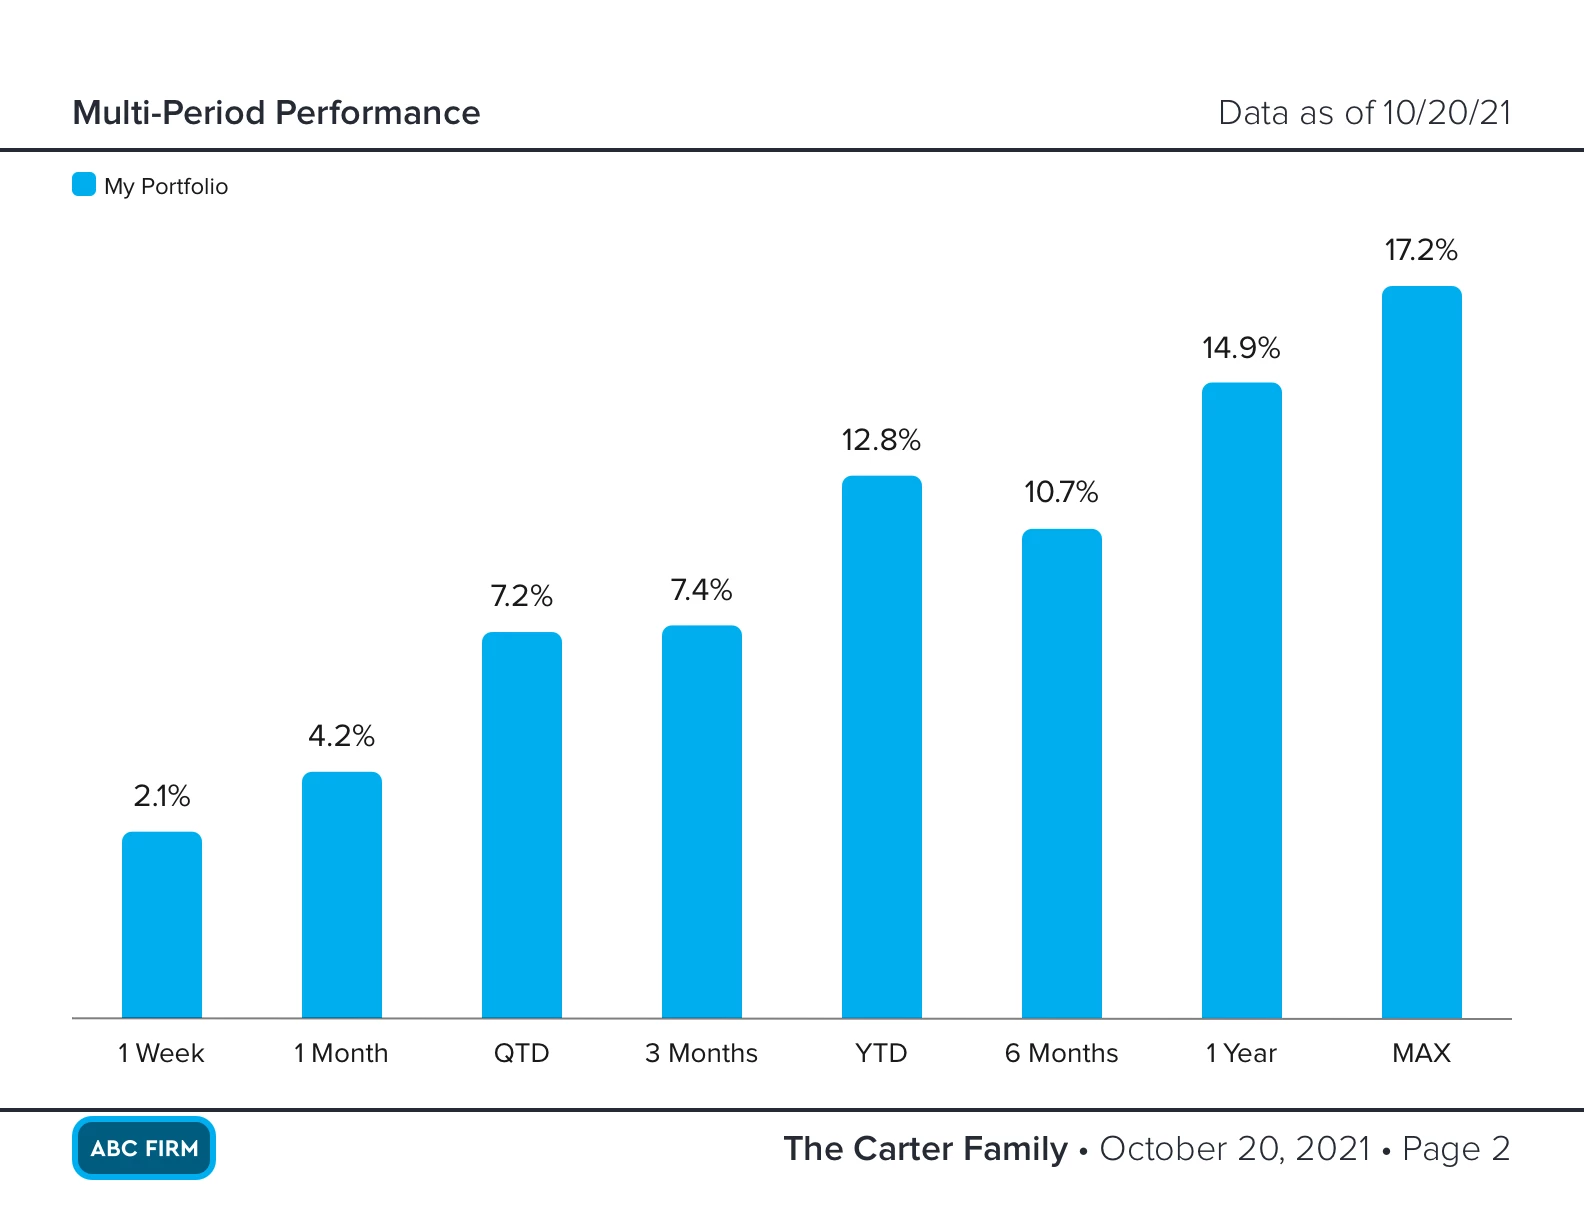
Multi-Period Performance Graph
Some key notes:
-
When either option is selected, the PDF report will include each option as a single page.
-
If users select the Multi-Period Table option, the Activity Summary option will be disabled as the data on the Activity Summary option is redundant.
-
If users select the “Fixed Time Periods” option, the Report Table and Graph will display the available time periods.
-
If users select the “Custom Time Periods” option, the Report Table and Graph will display both the custom time period and the available fixed time periods.
Below are examples of how the multi-period performance displays on PDF Reports: