The CircleBlack Advisor Dashboard provides you the ability to look at your entire book of business, drill down into every household and the accounts you manage, and view a range of important data relevant to you, all in customizable tiles that can be arranged in any order you like.
Book of Business Overview
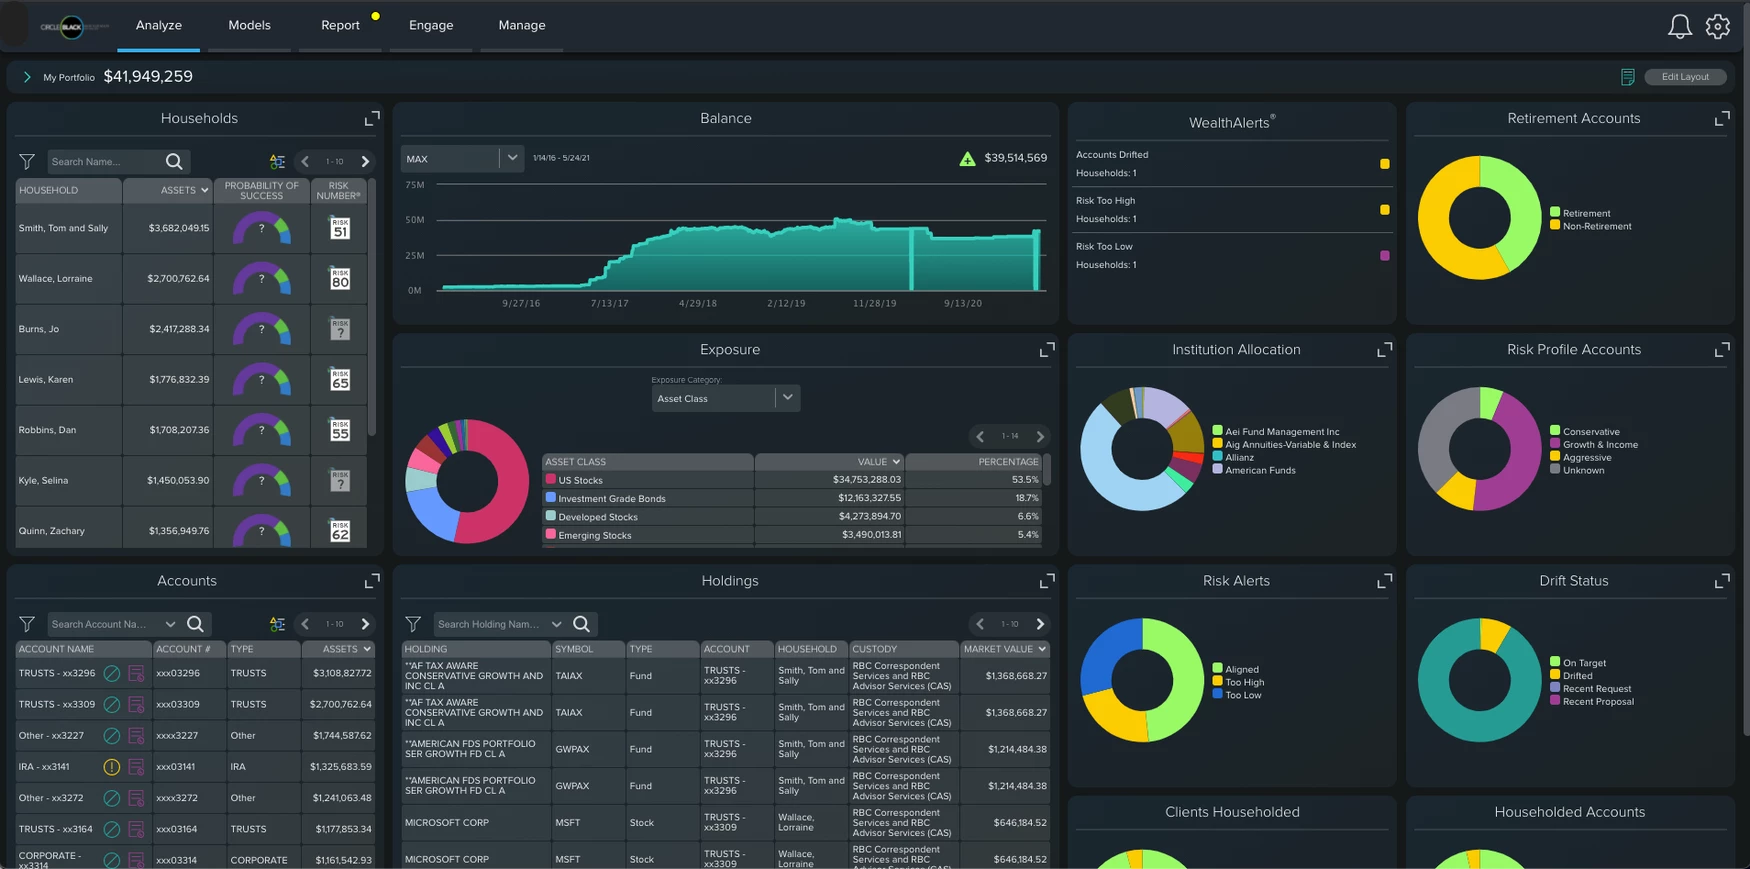
The Advisor Dashboard page provides a “book of business” level view of the following:
-
The Big Number displays in the upper left next to “My Portfolio”
-
This is the total balance of all the assets you manage including held-away accounts your Households have shared with you.
-
-
The Households tile lists your top 10 households and has functionality to search, view all your households, and filter to see new households.
-
The Balance tile displays a mountain graph of your assets over a selected time period and the change in balance of your assets during that time period.
-
The WealthAlerts® tile displays automated check-ups the system provides on your Household’s portfolios. There are currently four CircleBlack-generated Wealth Alerts® and they are defined as follows:
-
Aggregation Alert: Households who linked outside accounts need re-validate their credentials to get updated account data
-
Rebalance Drift: The allocations of a specific account differ from the most recent rebalance proposal
-
If you have integrated your Risk Analysis partner with CircleBlack, CircleBlack will also provide Risk-generated Wealth Alerts® for Households and Accounts with various Risk alerts.
-
Large Contribution/Withdrawal: Identifies large transactions in client accounts
-
-
The Tasks tile displays any tasks created in your integrated CRM software. Currently, tasks display from Redtail and Wealthbox.
-
The Accounts tile lists your top 10 accounts and has functionality to search, view all accounts, and filter to see new accounts, account types, institutions, data feed status, drift status, risk profile, or retirement.
-
The Holdings tile lists your top 10 holdings and has functionality to search, view all holdings that you manage, and filter the holdings by institution.
-
The Exposure tile displays a donut graph and table of your overall exposure across the following categories: Asset Class, Stock Sector, Bond Sector, Region, and Country.
-
The Institution Allocation tile displays a donut graph of all the institutions at which your Household’s accounts are held. Expanding this tile displays a table of your institutions, the number of accounts each, their total asset value, and the percentage those accounts make up.
-
The Retirement Accounts tile displays a donut graph showing the number of retirement and non-retirement accounts you manage. Expanding the tile displays a table of those counts, which can be clicked to view a list of accounts filtered to either retirement or non-retirement.
-
The Risk Alerts tile displays a donut graph showing the number of households that have a particular risk status: Risk Aligned, Risk Too High, or Risk Too Low.
-
The Risk Profile Accounts tile displays a donut graph showing the number of accounts that have a particular risk profile: Conservative, Growth & Income, Aggressive, or Unknown.
-
The Drift Status tile displays a donut graph showing the number of accounts that have a certain drift status: No Model, On Target, Drifted, Recent Request, Recent Proposal
-
The Clients Householded tile displays a donut graph showing the number of clients that are either mapped to a household or not mapped to a household. To map clients to a household, go to Manage → Clients → Householding.
-
The Householded Accounts tile displays a donut graph showing the number of accounts that either assigned to a household or not assigned to a household. To ensure accounts are assigned to a household, go to Manage → Clients → Householding.
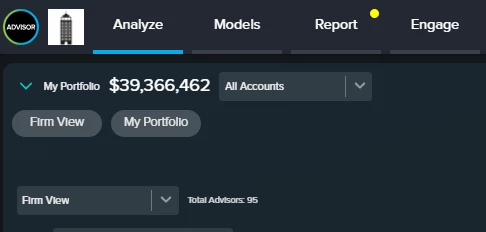
Understanding Views within the Dashboard
Within the Advisor portal, advisors can view data at the following levels:
- Firm-View (Firm Managers Only)
- Branch View (Branch managers & Firm Managers Only)
- Household View
- Account View
- Group View
Note: Firm managers can toggle between viewing their firm’s dashboard and personal book of business via the collaposible section at the top of the portal.
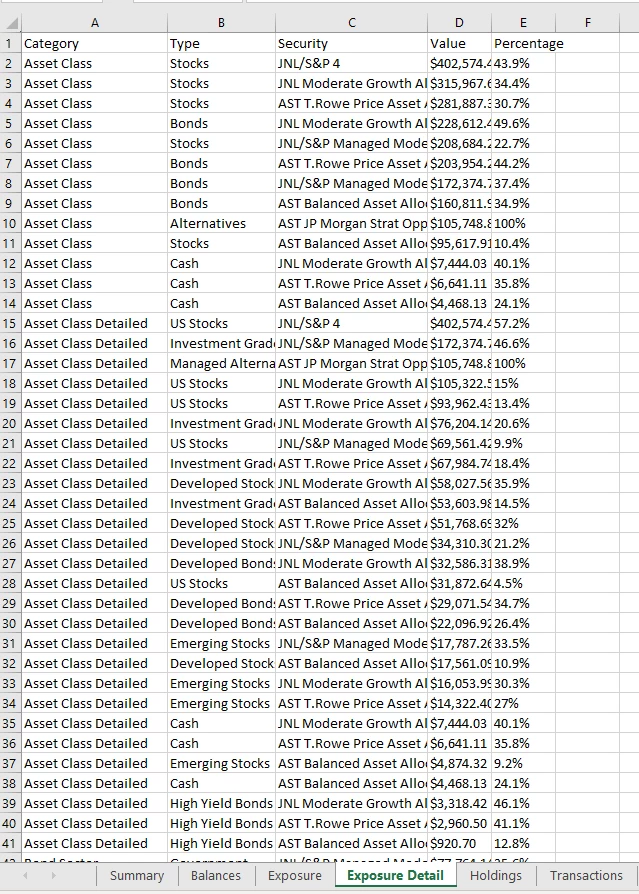
Exporting Dashboard Data
Advisors can export dashboard data selecting the export icon in the top right of any dashboard.

After selecting the export time period, the report will be me available in Reports/ DocVault (if applicable to your firm).
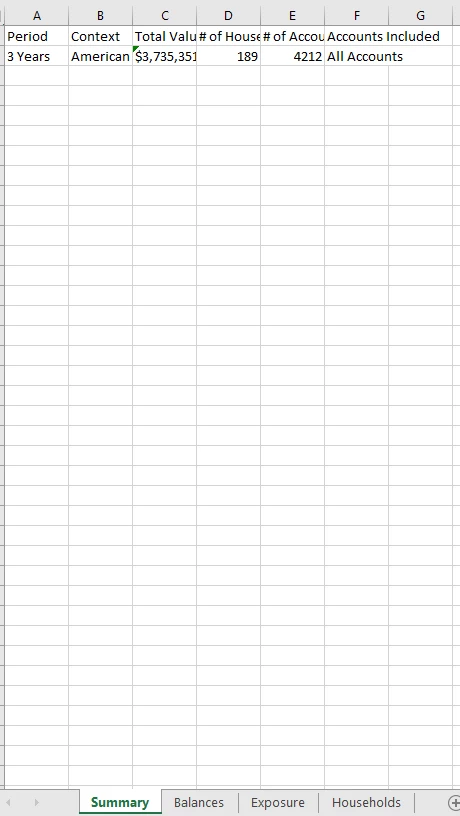
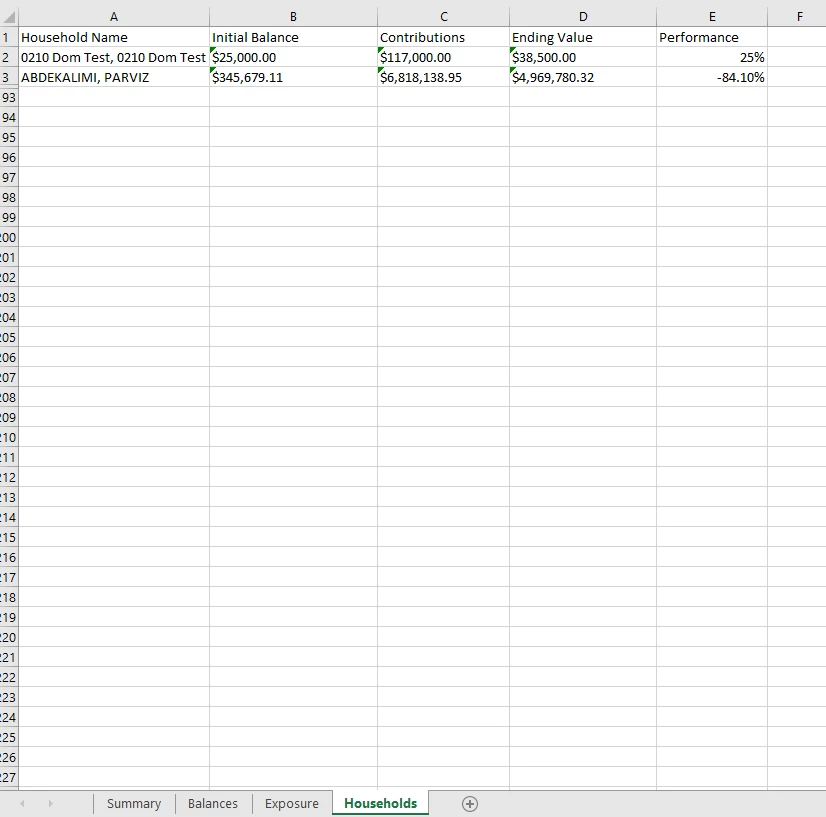
Firm Export
The firm export will contain tabs displaying the following information:
- Summary
- Balance over time period
- Firm Wide Exposure
- Performance by Household
Advisor/Household/Group Overview
The following columns are available for the advisor/household/group overview:
- Summary
- Balances
- Exposure
- Exposure Details (Asset Class Detail)
- Holdings
- Transactions